[DSP] W03 - Discrete Fourier Transform
contents
fourier basis
-
for \(\mathbb{C}^N\)
- in signal notation:
- \(w_k[n] = e^{j\frac{2\pi}{N}nk}\), for \( n,k = 0,1,\ldots,N-1 \)
- in vector notation
- \( \{ \textbf{w}^{(k)}\}_{k = 0,1,\ldots,N-1} \)
- with \( w_n^{(k)} = e^{j\frac{2\pi}{N}nk}\)
- Fourier Basis are a set of N orthogonal vectors
- hence are a basis for \(\mathbb{C}^N\)
- they are not orthonormal, normalization factor is \( \frac{1}{\sqrt{N}} \)
- will keep normalization factor explicit in DFT formulas
basis expansion
analysis formula
- \( X_k = \langle \textbf{w}^{(k)}, x \rangle \)
synthesis formula
- \( x = \frac{1}{N}\sum_{k=0}^{N-1}X_k\textbf{w}^{(k)} \)
change of basis in matrix form
- analysis formula:
- \( \textbf{X} = \textbf{W}\textbf{x} \)
- synthesis formula:
- \( x = \frac{1}{N}\textbf{W}^H\textbf{X} \)
signal notation
- analysis formula:
- \( X[k] = \sum_{n=0}^{N-1}x[n]e^{-j\frac{2\pi}{N}nk} \)
- \( k = 0,1,\ldots,N-1 \)
- N point signal in the frequency domain
- \( X[k] = \sum_{n=0}^{N-1}x[n]e^{-j\frac{2\pi}{N}nk} \)
- synthesis formula:
- \( x[n] = \frac{1}{N} \sum_{k=0}^{N-1} X[k] e^{j\frac{2\pi}{N}nk} \)
- \( n = 0,1,\ldots, N-1 \)
- N point signal in time-index domain for discrete time
- \( x[n] = \frac{1}{N} \sum_{k=0}^{N-1} X[k] e^{j\frac{2\pi}{N}nk} \)
DFT calculations
dft is linear
- \( DFT \{ \alpha x[n] + \beta y[n] \} = \alpha DFT \{ x[n] \} + \beta DFT \{ y[n] \} \)
dft of \( \delta[n] \)
- here: \(x[n] == \delta[n] \)
- \( X[k] = \sum_{n=0}^{N-1}x[n]e^{-j\frac{2\pi}{N}nk} \)
- \( \sum_{n=0}^{N-1}\delta[n]e^{-j\frac{2\pi}{N}nk} = 1\)
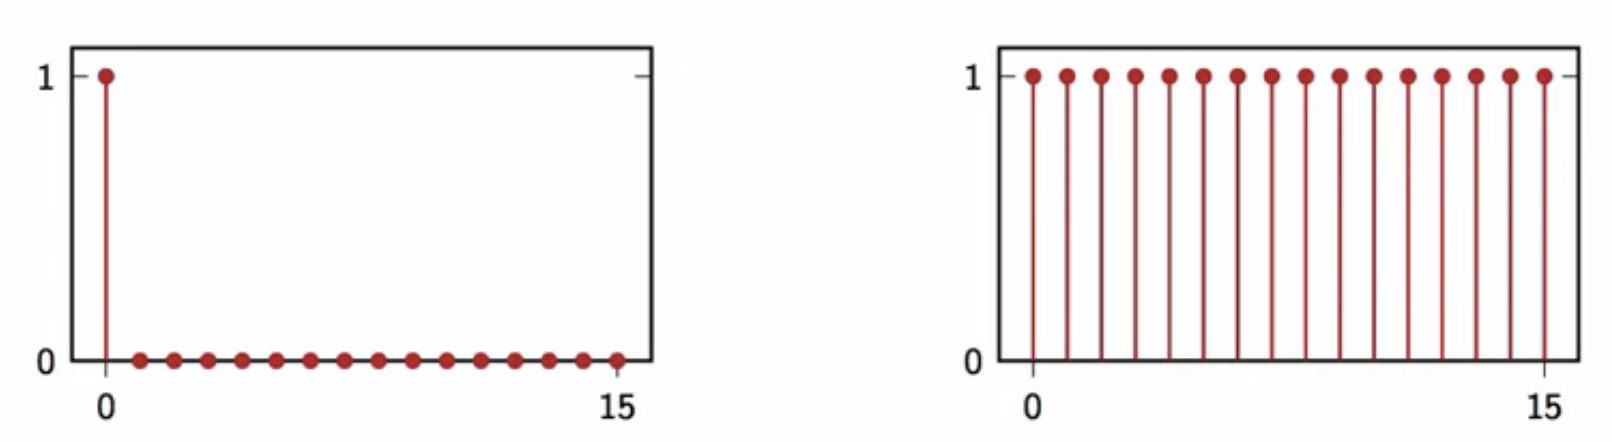
fig: fourier transform of discrete-time delta
dft of \( x[n] = 1 \)
-
for \( x[n] \in \mathbb{C}^N\)
-
\( X[k] = \sum_{n=0}^{N-1}x[n]e^{-j\frac{2\pi}{N}nk} \)
- \( \sum_{n=0}^{N-1}e^{-j\frac{2\pi}{N}nk}\)
- \( N\delta[k] \)
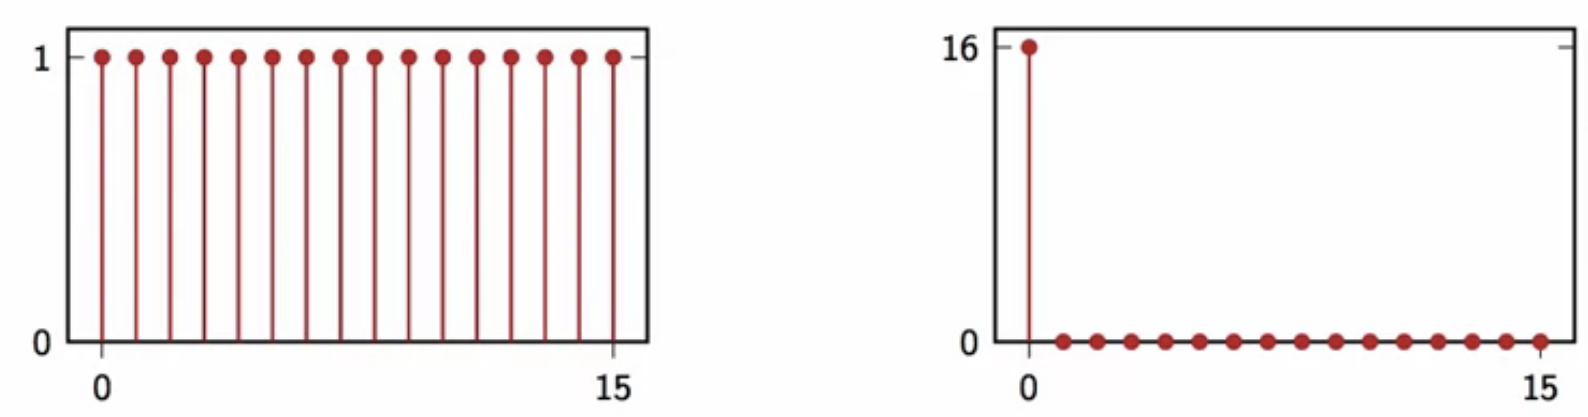
fig: fourier transform of function 1
dft of \( x[n] = 3 \cos{\frac{2\pi n}{16}} \)
-
for \( x[n] \in \mathbb{C}^{64}\)
-
in \( \mathbb{C}^{64} \), the fundamental frequency of the fourier transform is \( \omega = \frac{2\pi}{64} \)
- \( x[n] = 3 \cos{\frac{2\pi n}{16}} \)
- \( = 3 \cos{\frac{4 (2\pi) n}{64}} \)
- use expansion: \( \cos \omega = \frac{ e^{j\omega} + e^{-j\omega} }{2} \)
- \( = \frac{3}{2}\Big[ e^{j\frac{2\pi}{64} (4n)} + e^{-j \frac{2\pi}{64} (4n)} \Big] = \frac{3}{2}\Big[ e^{j\frac{2\pi}{64} (4n)} + e^{j \frac{2\pi}{64} (60n)} \Big] \)
- \( = \frac{3}{2}\Big( w_4[n] + w_{60}[n] \Big) \)
- so \( X[k] = \langle w_k[n],x[n] \rangle \)
- \( = \langle w_k[n], \frac{3}{2}(w_4[n] + w_{60}[n]) \rangle \)
- \( = \frac{3}{2} \langle w_k[n], w_4[n] \rangle + \frac{3}{2} \langle w_k[n] + w_{60}[n]) \rangle \)
- \( = \bigg \{ \begin{matrix} 96 & for \text{ } k = 4,60 \\ 0 & otherwise \end{matrix} \)
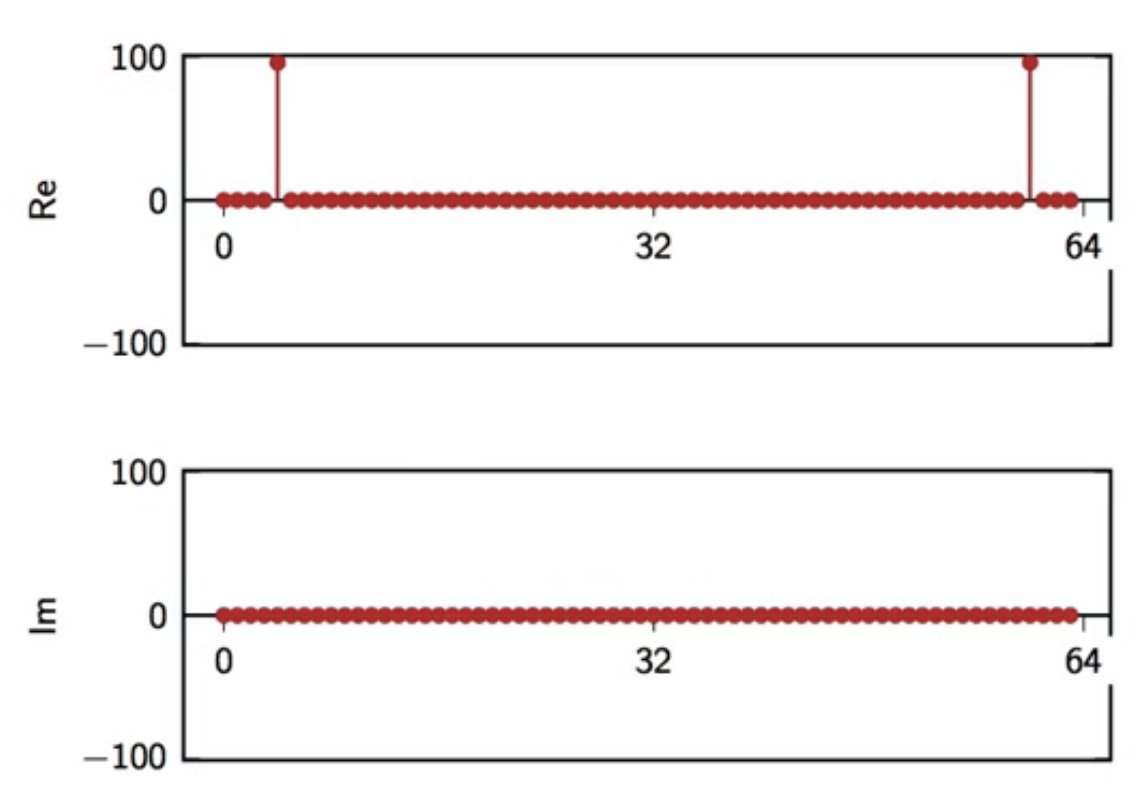
fig: [Re] and [Im] of DFT of \( x[n] = 3 \cos{\frac{2\pi n}{16}} \)
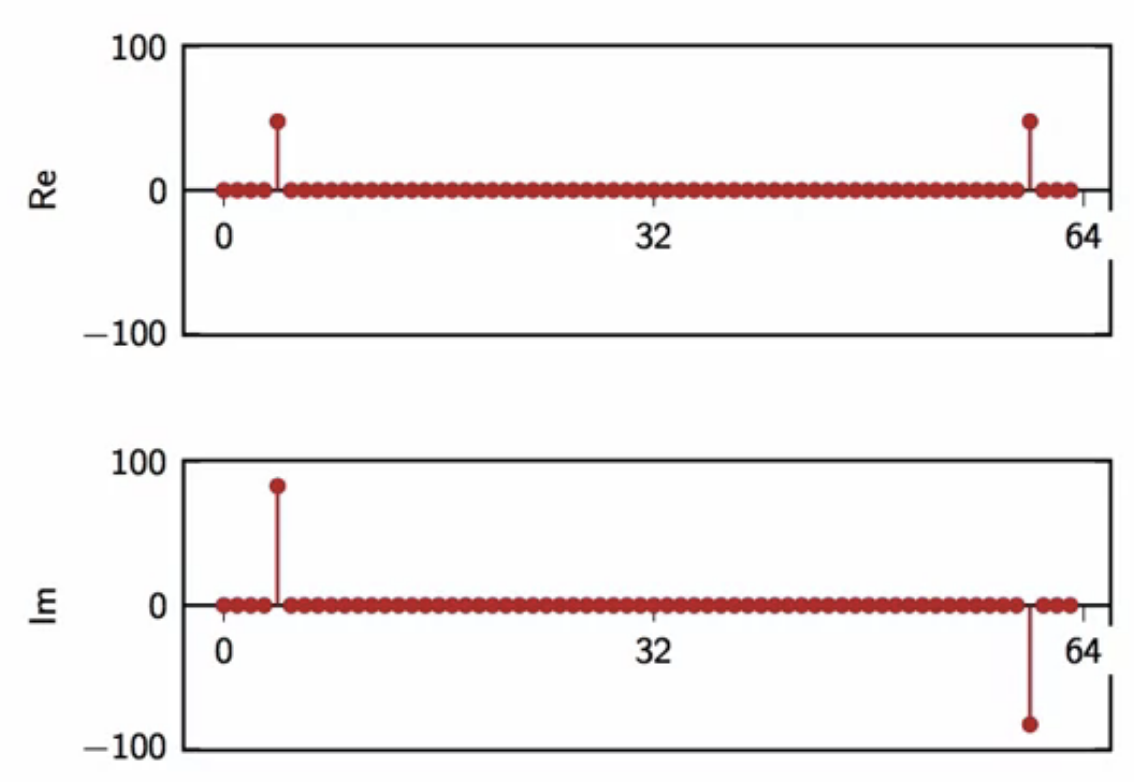
fig: similarly, [Re] and [Im] of DFT of \( x[n] = 3 \cos{\frac{2\pi n}{16} + \frac{\pi}{3}} \)
interpreting a dft plot
rotation direction
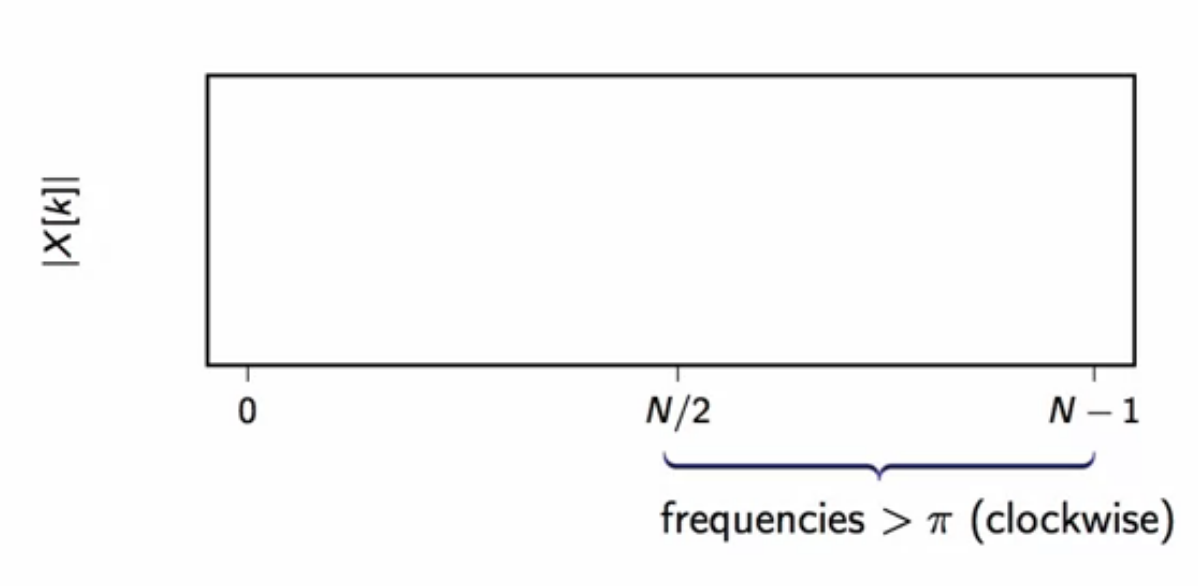
fig: dft chart frequency rotation
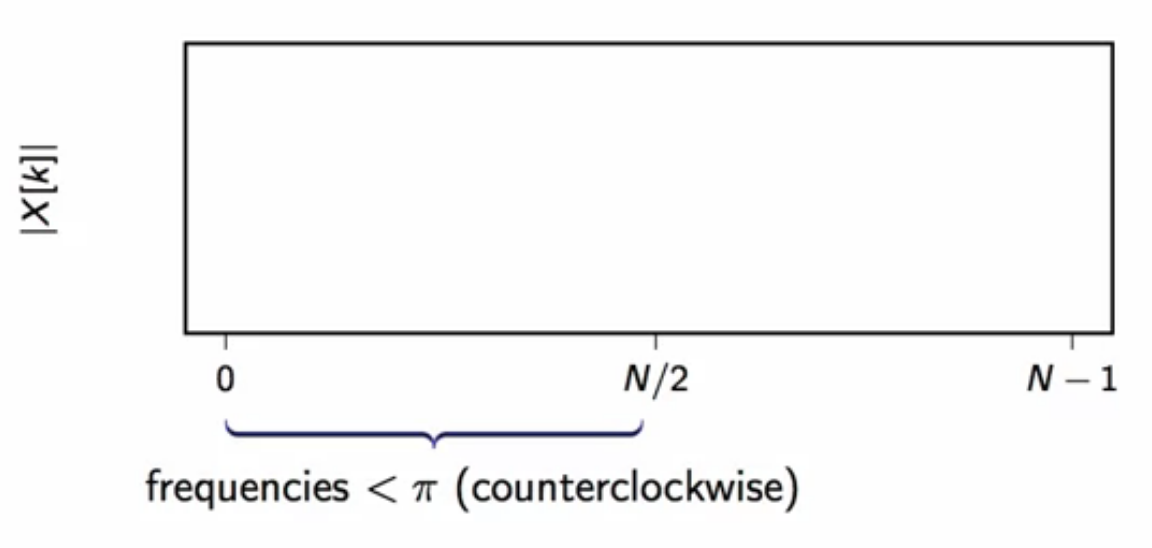
fig: dft chart frequency rotation
speed distribution
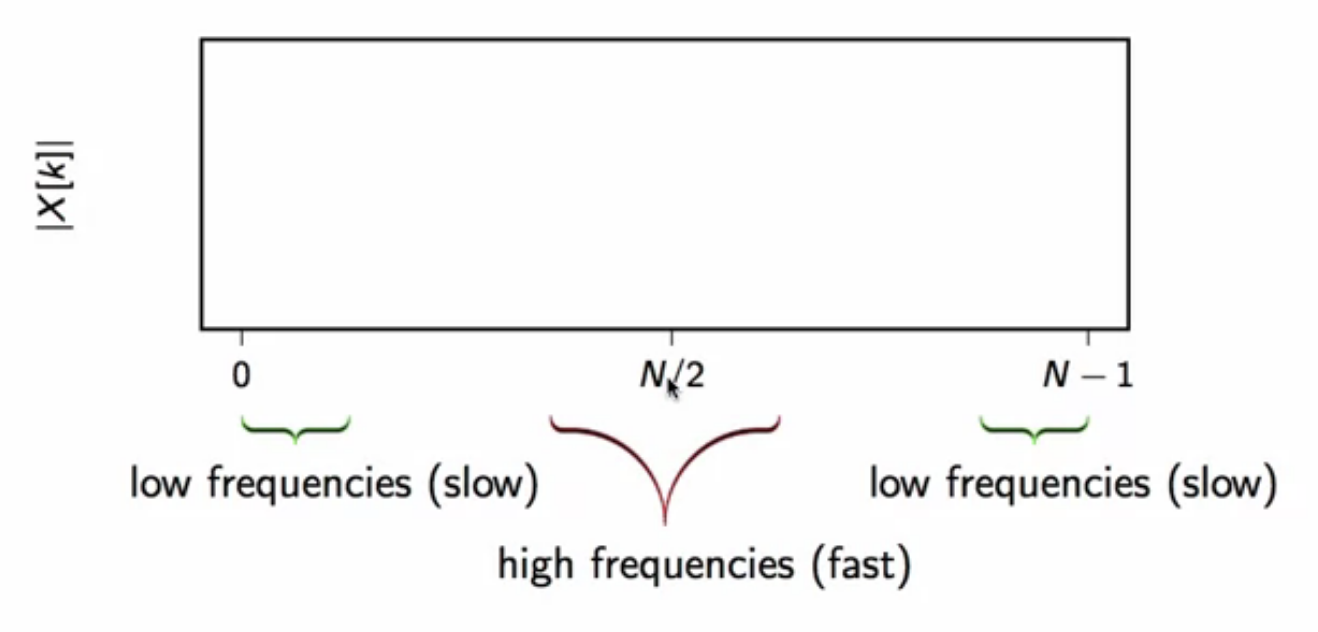
fig: dft chart frequency distribution
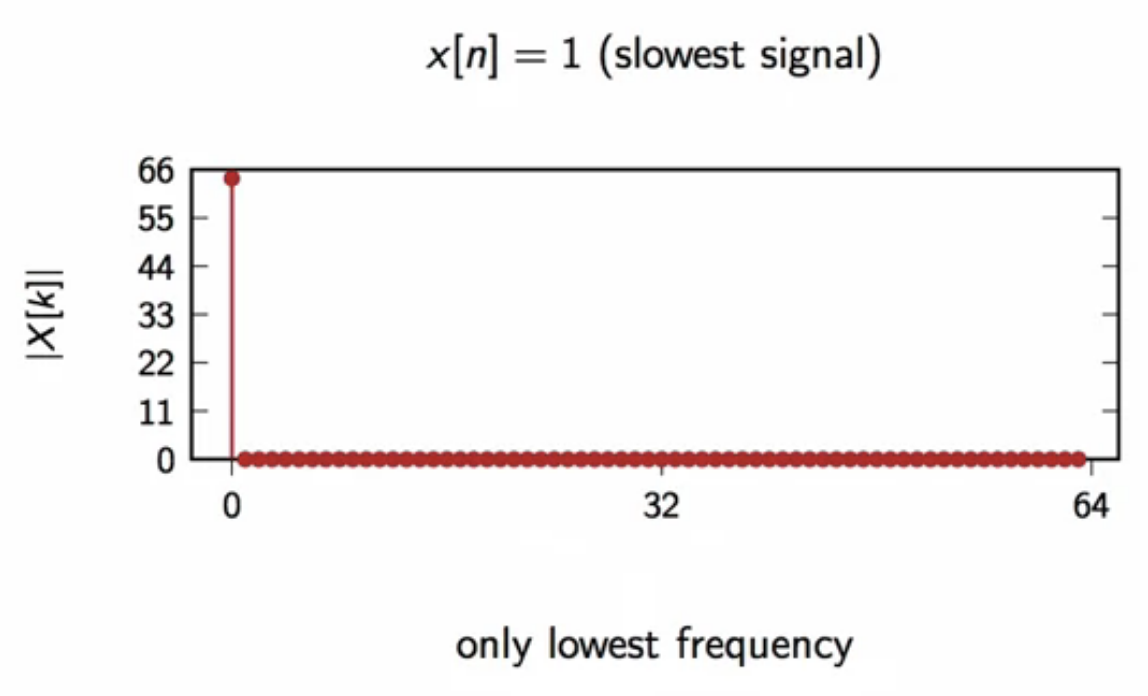
fig: stationary frequency (k=0)
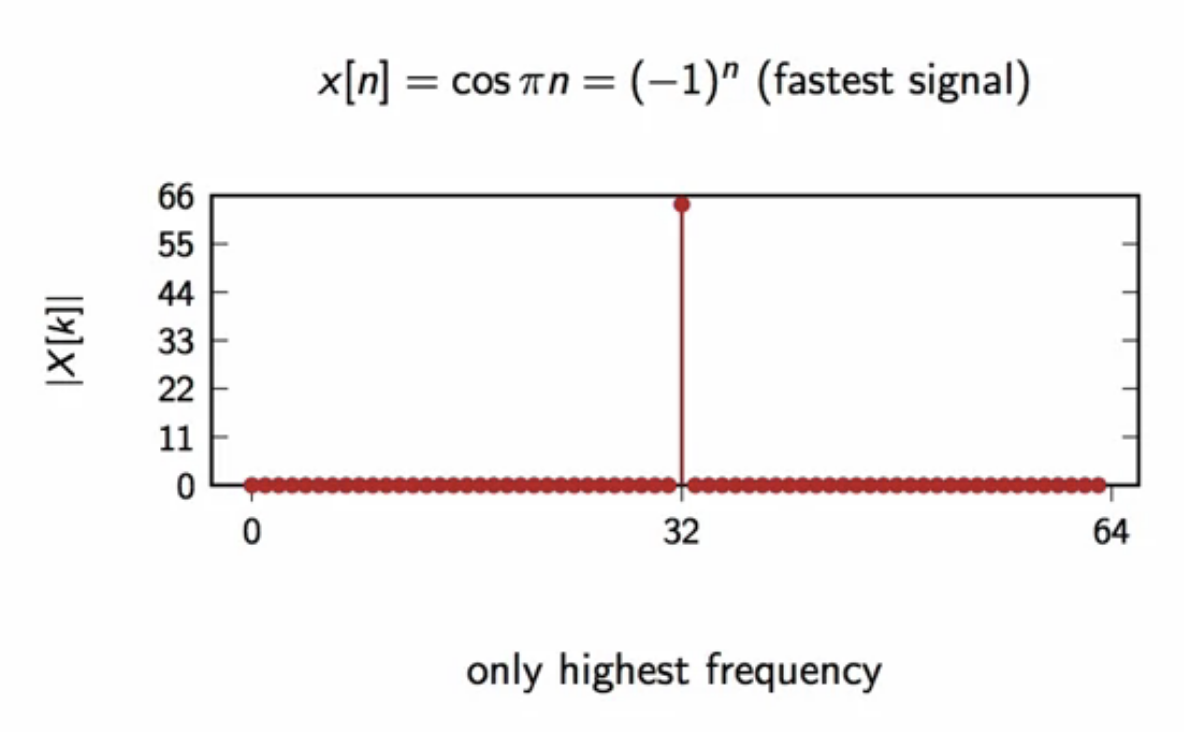
fig: fastest frequency (k=32)
energy distribution
- Conservation of Energy across domains:
- underlying energy of a signal doesn’t change with change of basis
- Square magnitude of k-th DFT coefficient proportional to signal’s energy at frequency \( \omega = \frac{2\pi}{N}k\)
dft of real signals
- dft of real signals are symmetric in magnitude
dft in practice
- the highest frequency of a digital system is half of the inherent sampling rate
- \(f_{max} = \frac{F_s}{2}\)
- in the DFT window, this corresponds to the mid-point of the window
- i.e. \( k = \frac{N}{2} \)
- so first find \( k = \frac{N}{2} \), and set that equal to half the sampling frequency
- then, use linear interpolation to find that smaller components’ frequencies
- \( f_s = \frac{\frac{F_s}{2}k}{\frac{N}{2}} \)
fourier analysis of musical instruments
- the played note is the first peak: 220Hz for example
- this is the pitch of the instrument
- the other peaks are called harmonics, they define the typical sound of the instrument
short-time fourier transform (STFT)
- dual-tone multi frequency (dtmf dial phone)
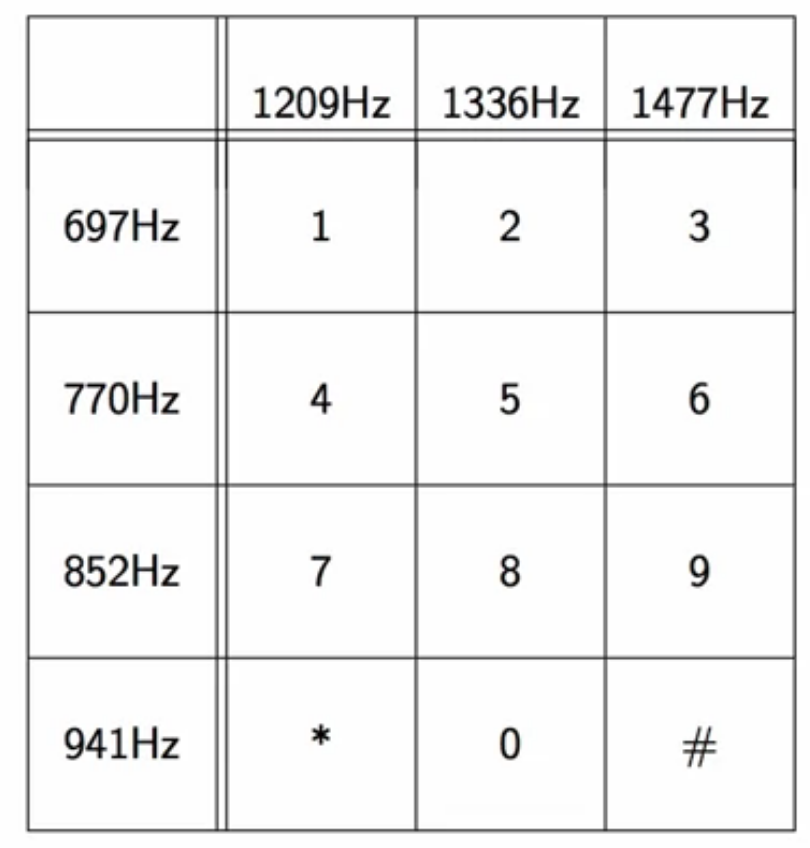
fig: dtmf dial-pad
- when say key 4 is pressed,
- two sinusoids are generated, one specified at the row and another by the column
- 770 Hz and 1209 Hz
- the frequencies are chosen such that they are co-prime
- no sum or differences in frequencies are the same as the any of the chosen frequencies
-
goal is to minimized errors while decoding pressed numbers at the exchange
- fundamental trade-off in signals
- time representation obfuscates frequency information
- frequency representation obfuscates time
- so, the signal at the exchange is subjected to DFT in small chucks of window
- each window is applied to the burst of sound corresponding to a key press
- so, in that way STFT is just standard DFT applied to a restricted portion of a signal
- it is useful to obtain simultaneously obtain time and frequency information
the spectrogram
- color-code the magnitude
- dark is small
- white is large
- use \( 10 \text{ } log_{10}(\vert X[m;k]\vert) \) to see better (power in dBs)
- plot spectral slices one after another
- spectrogram can be applied to visualize the numbers dialled using a DTMF dialpad
-
spectrogram can be wide-band or narrow-band, based on the number of points samples
- in a long window, more frequency resolution can be had
- but since it is sensitive to a lot of things happening over time, it is not precise in time
- in a short window, many time slices - precise location of transitions
- short window, fewer DFT points - poor frequency resolution
- to better localize the position of a start and end of a key press, the length of the DFT has to be reduced
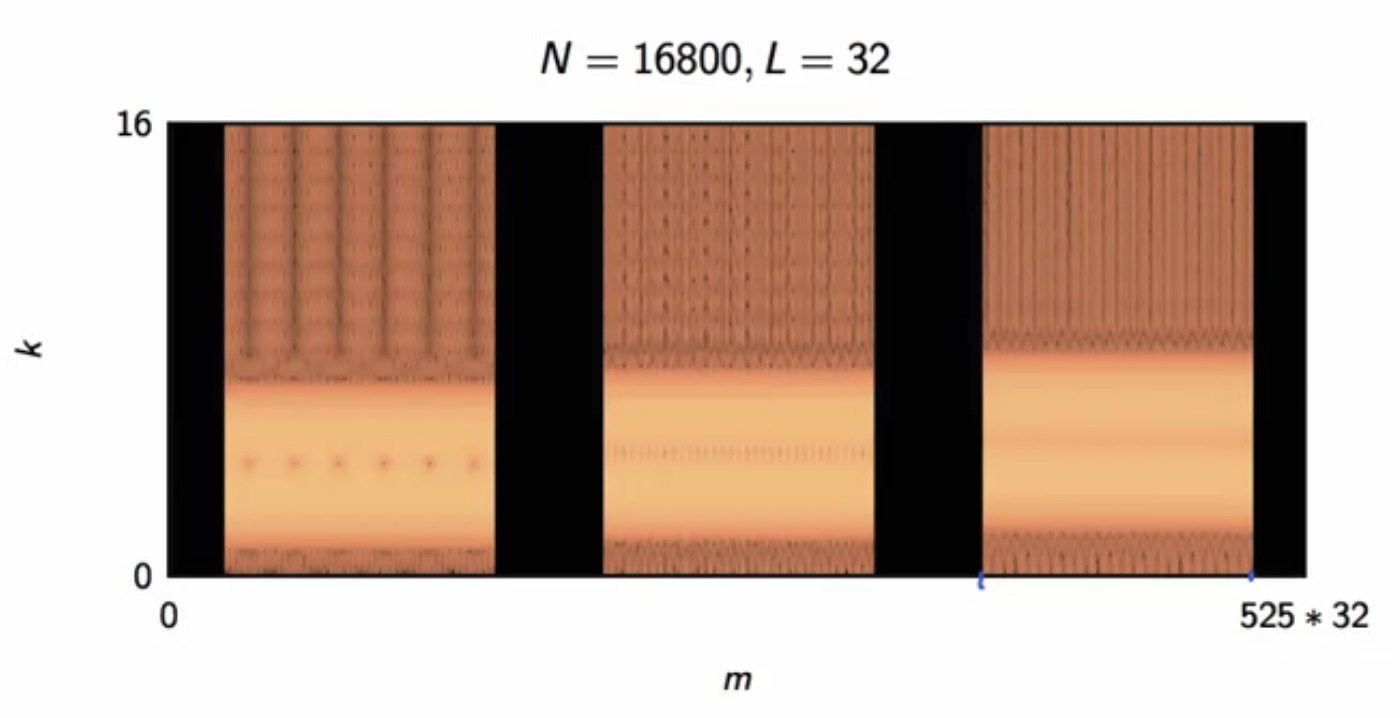
fig: dtmf dial-pad wideband spectrogram
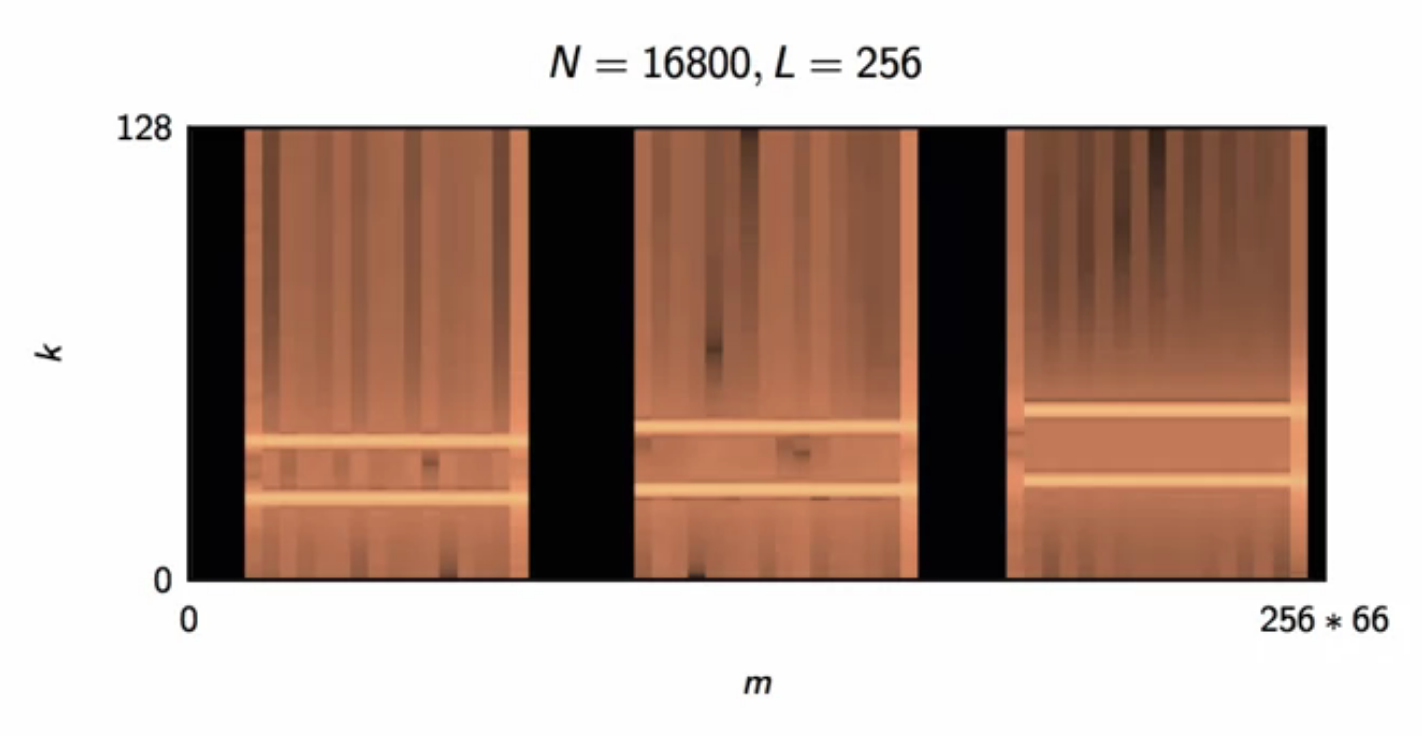
fig: dtmf dial-pad medium band spectrogram
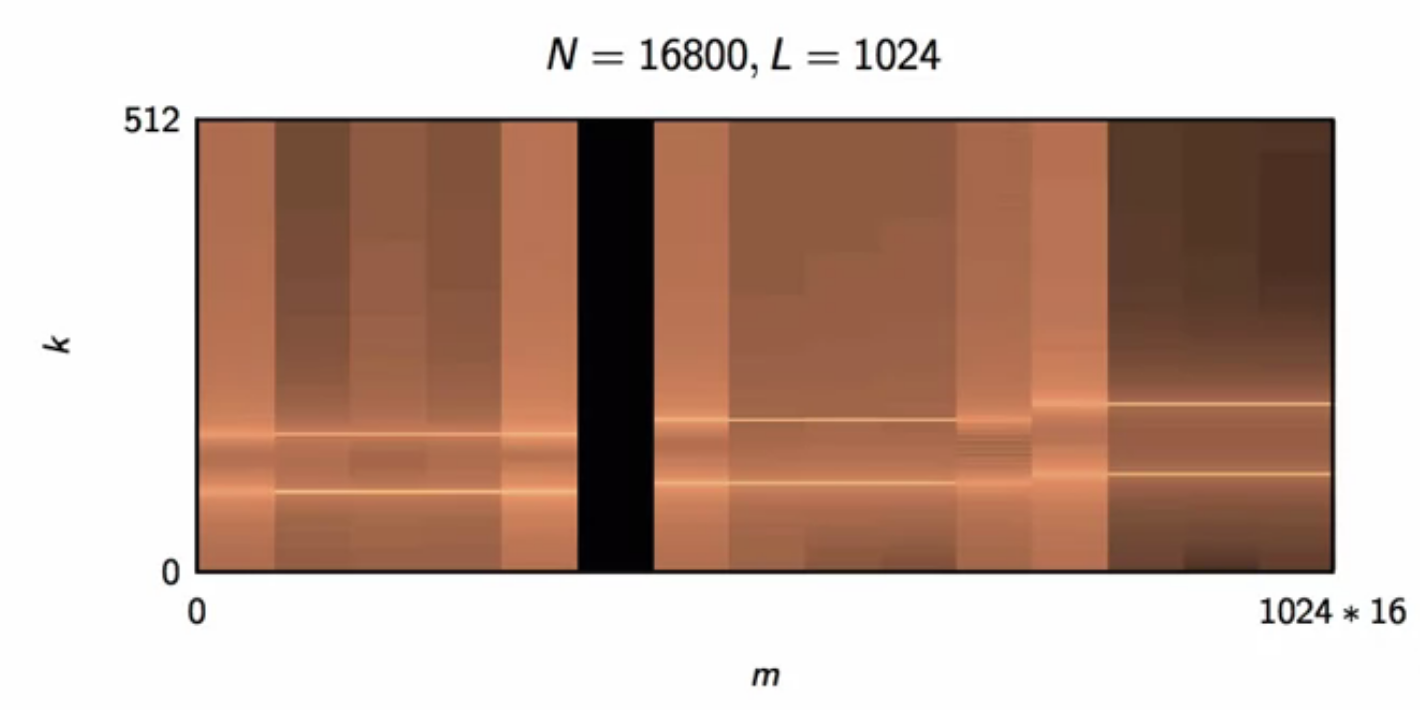
fig: dtmf dial-pad super narrow band spectrogram